New cities, new tools, and Pabulib at 1,987 datasets
Hi!
Pabulib now contains 1,987 files. We are only 13 files away from 2,000.
Across the whole library, we now cover 30 cities, 37,522 projects, and 8,483,967 vote records.
This is a pretty big update! The main chunk listed below brings in 201 files, covering 1,534 projects and 711,201 votes. Six cities are making their first appearance in Pabulib: Lublin, Rzeszów, Kielce, Radom, Olsztyn, and Bydgoszcz. We’ve also added new editions from Świecie, Częstochowa, and Assen in the Netherlands, plus our very first dataset from a province rather than a city: the participatory budget of the Łódzkie Voivodeship.
This actually leaves us with a little naming puzzle: our filter is currently called City, but since not everything in the library is a city anymore, that doesn’t quite fit. Should we change it to Place, City / region, or maybe go with the technically correct (but a bit cold) Unit? If you have a better idea, we’d love to hear it!
The new datasets
| City (or region:) ) | Edition | Files | Fully funded | Projects | Vote records | Median QS |
|---|---|---|---|---|---|---|
| Lublin | 2020 | 29 | 6 | 149 | 63,848 | 167.0 |
| Łódzkie Voivodeship | 2024 | 23 | 1 | 181 | 153,870 | 447.9 |
| Świecie | 25,26 | 2 | 0 | 40 | 5,915 | 10,733.6 |
| Częstochowa | 2026 | 21 | 0 | 397 | 43,025 | 1,030.4 |
| Rzeszów | 2026 | 35 | 11 | 161 | 142,755 | 72.9 |
| Kielce | 2026 | 6 | 0 | 85 | 64,428 | 1,552.3 |
| Radom | 2026 | 3 | 0 | 178 | 152,118 | 14,690.6 |
| Olsztyn | 2027 | 23 | 7 | 75 | 28,542 | 158.0 |
| Bydgoszcz | 2025 | 59 | 10 | 268 | 56,700 | 55.6 |
| Total | 201 | 35 | 1,534 | 711,201 |
Some of these datasets are fully funded. This is not surprising: we have contacted all large Polish cities and processed all the data. But combining QS with the scale of the elections and the number of non-fully-funded files, Radom, Kielce, and Częstochowa currently stand out, so we will be particularly keen to follow their next elections.
Rule Comparison
Dataset preview pages now include a new Rule Comparison tab.
For supported approval-voting files, it compares the officially recorded winners with the winners produced by the Method of Equal Shares with Add1 and a comparison step (equalshares/add1-comparison). The view shows the overlap, projects selected only under the original rule, projects selected only under the alternative, and budget usage under both outcomes.
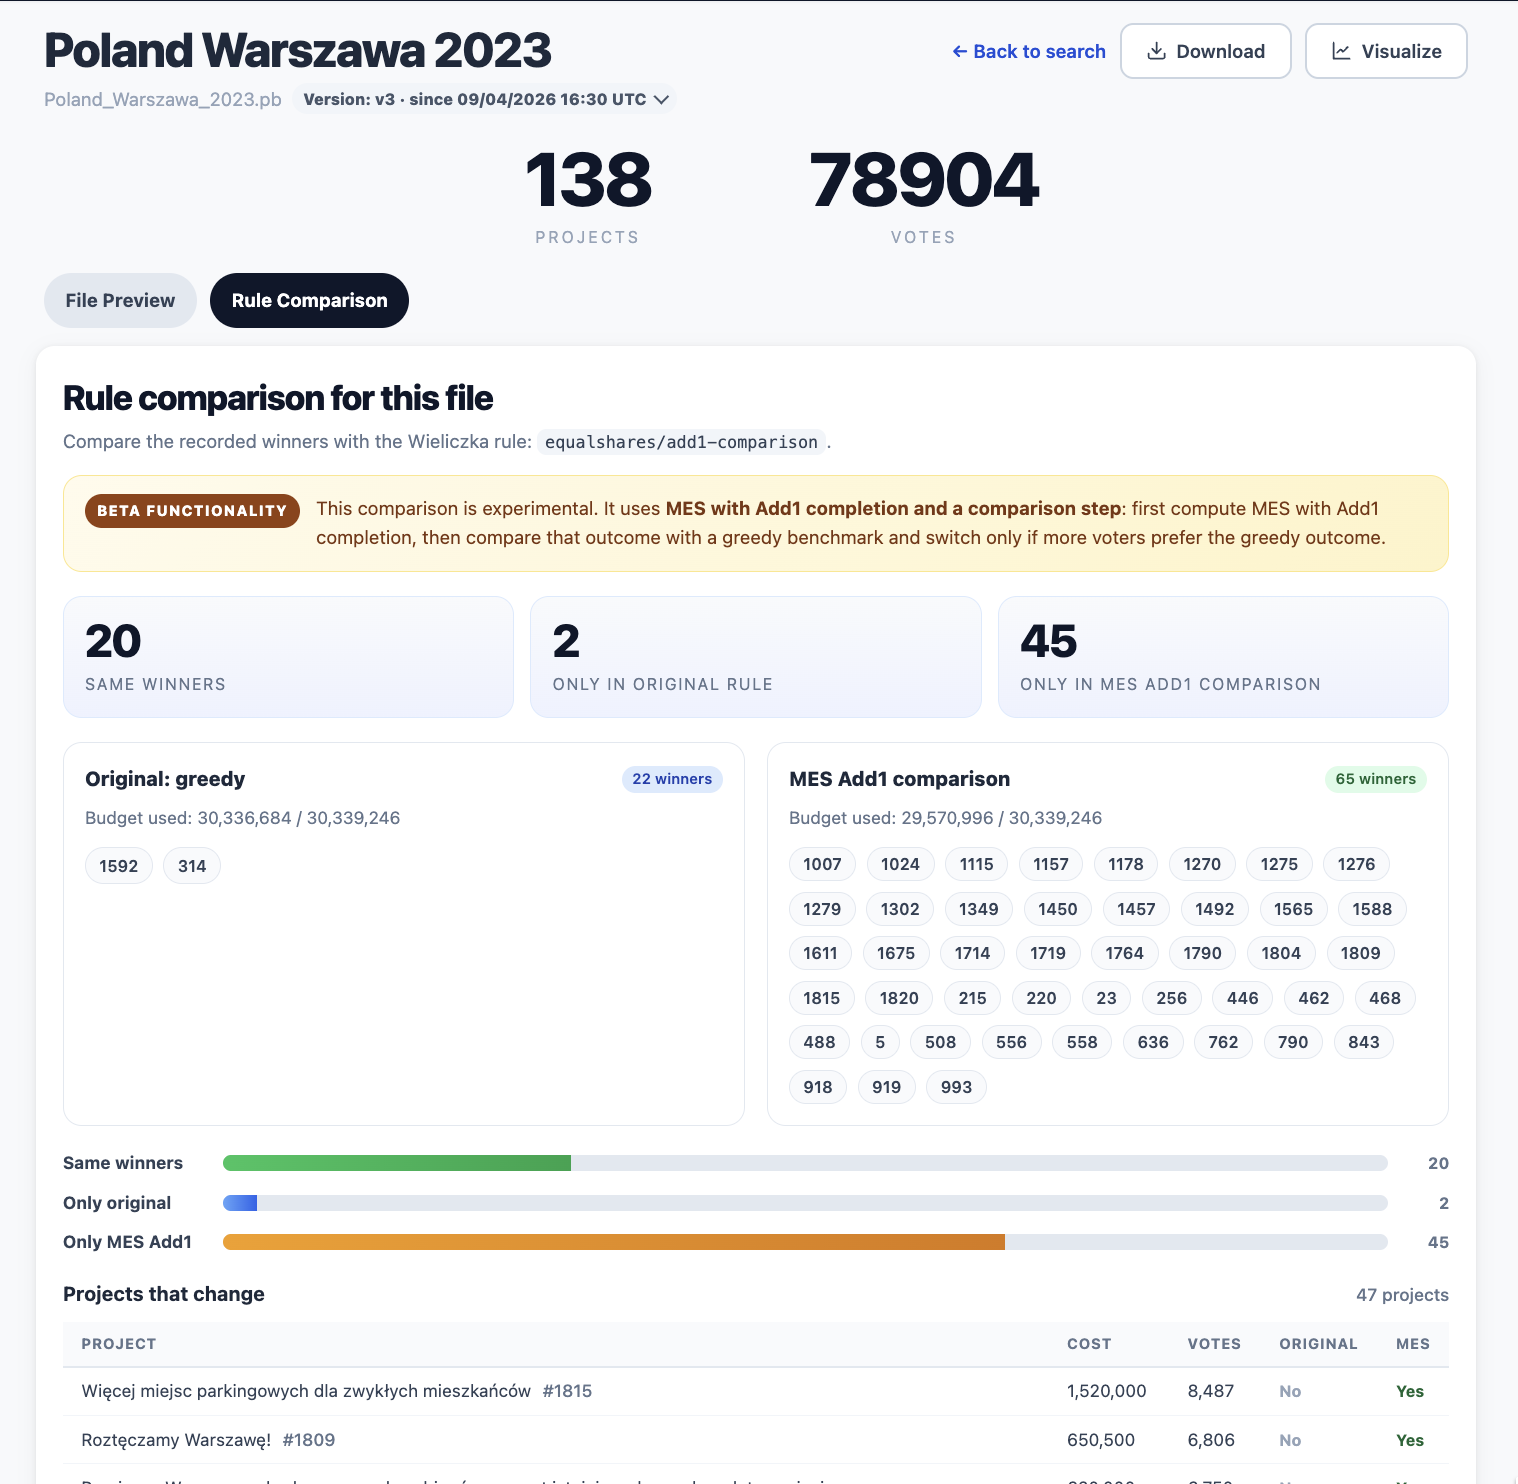
This feature is currently in beta, but it already makes it much easier to explore how a different voting rule could have changed an election.
Version history
Pabulib now keeps and displays the version history of datasets.
When a file is corrected or updated, its previous version is no longer hidden. On the preview page, you can open and download earlier versions and see when each version was current.
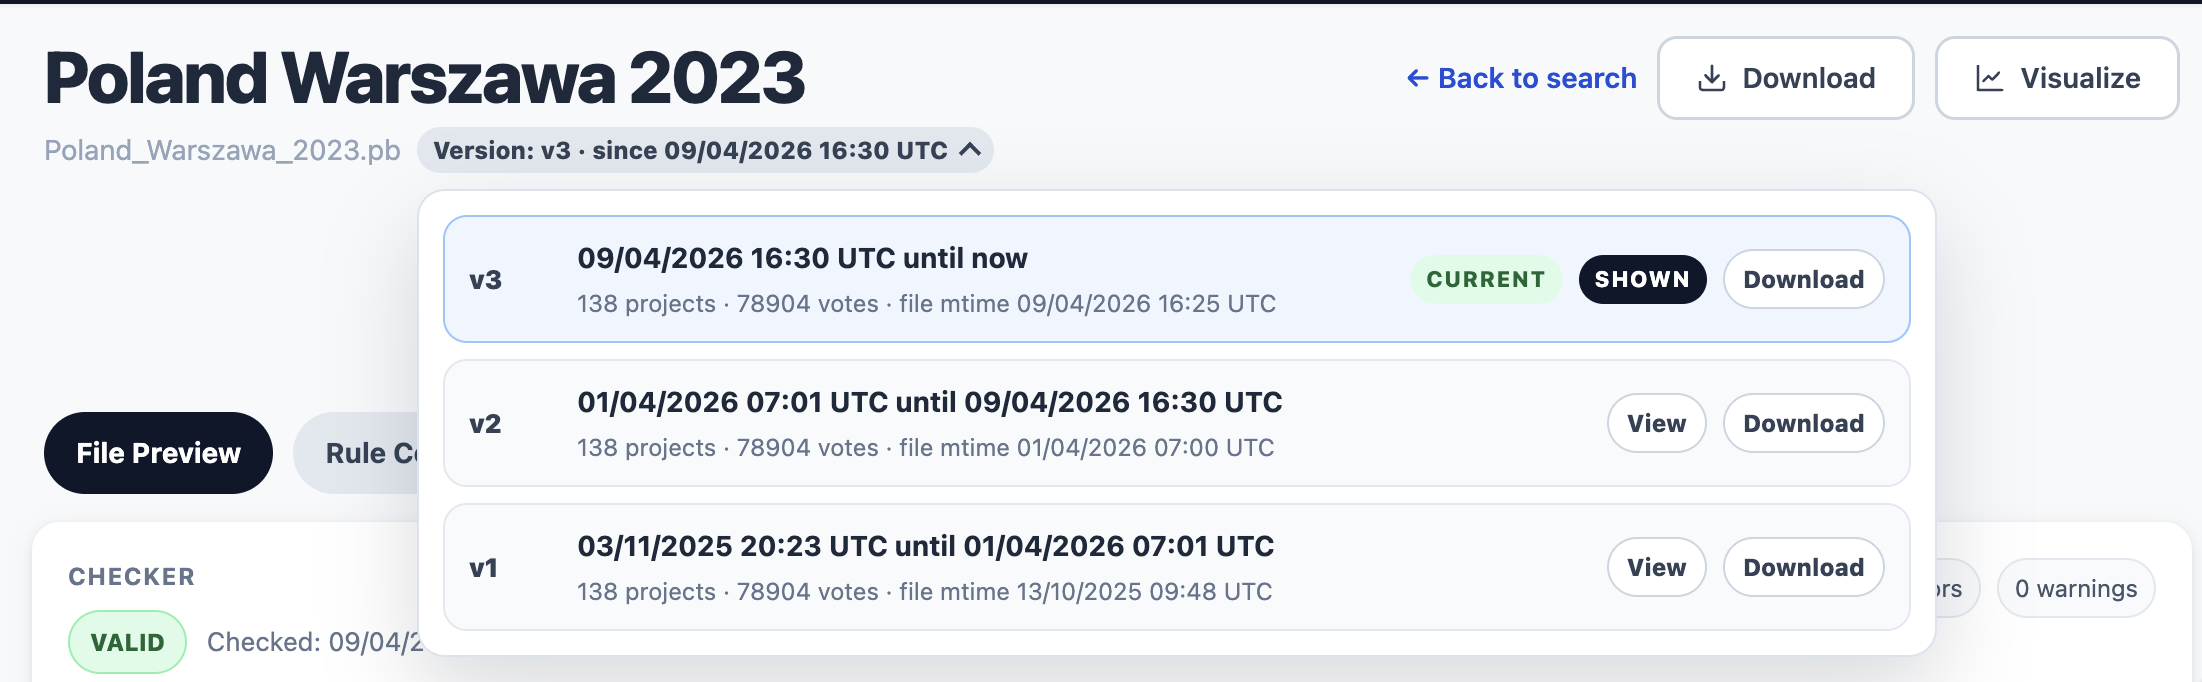
This makes corrections transparent and gives permanent links a clearer meaning.
Improved statistics
We fixed and redesigned the Statistics page.
The summary figures and charts are now easier to read across screen sizes, country names and flags are handled more consistently, and the page gives a clearer overview of files, cities, votes, projects, vote types, years, and budgets in the library.
Easier filter search
The city filter is becoming crowded, which is a good problem to have.
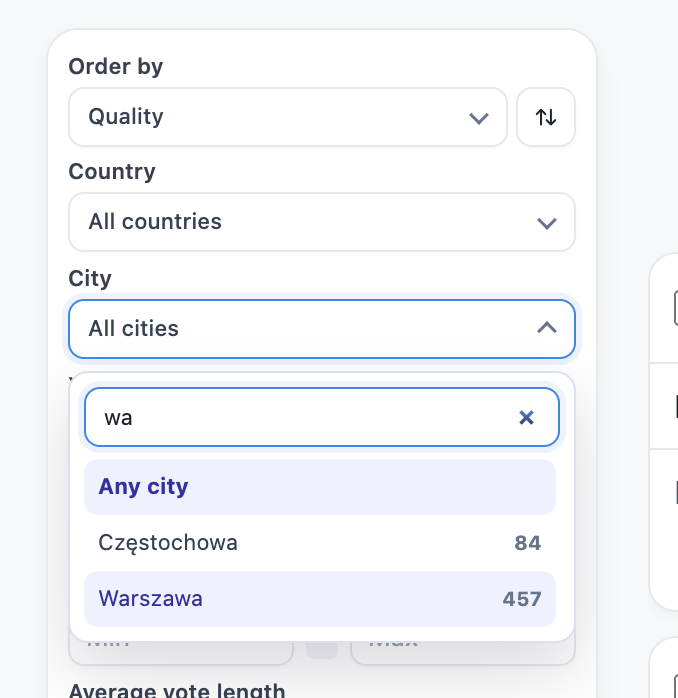
We added search inside the filter picker, so you can type a city name instead of scrolling through the complete list. The picker is also more responsive and easier to use on smaller screens.
Returning to Pabustats
We would also like to return to Pabustats, a project for exploring and comparing participatory budgeting data.
The expanded library, Quality Scores, rule comparison, and better version history give us a much stronger base than before. The open question is what would be most useful next: ready-made cross-city comparisons, rule-focused analyses, downloadable summary tables, reproducible notebooks, or something else entirely.
If you have used Pabustats before, have a research question that the current website does not answer, or would like to contribute an analysis, please get in touch. Suggestions at this stage can genuinely shape what we build.
Newsletter
Finally, Pabulib now has a newsletter.
You can sign up directly on the website to receive short updates about new datasets, tools, and blog posts. We do not plan to flood anyone’s inbox; the idea is simply to make it easier to follow the project.
We are now extremely close to 2,000 files. More new cities have been contacted, and it’s that time of year for the next editions (in the old ones). Hopefully, the next update will take us past that milestone!
Cheers!